
আরও দেখুন


 28.09.2026 11:13 AM
On Friday, EUR/USD made a corrective retracement toward the 76.4% retracement level at 1.1416, but the level itself was not tested. Thus, no sell signal was formed. A rebound from 1.1416 would favor the US dollar and a resumption of the decline toward the 100.0% Fibonacci level at 1.1325. Consolidation above 1.1416 would allow traders to expect further growth toward the next retracement level of 61.8% at 1.1473.
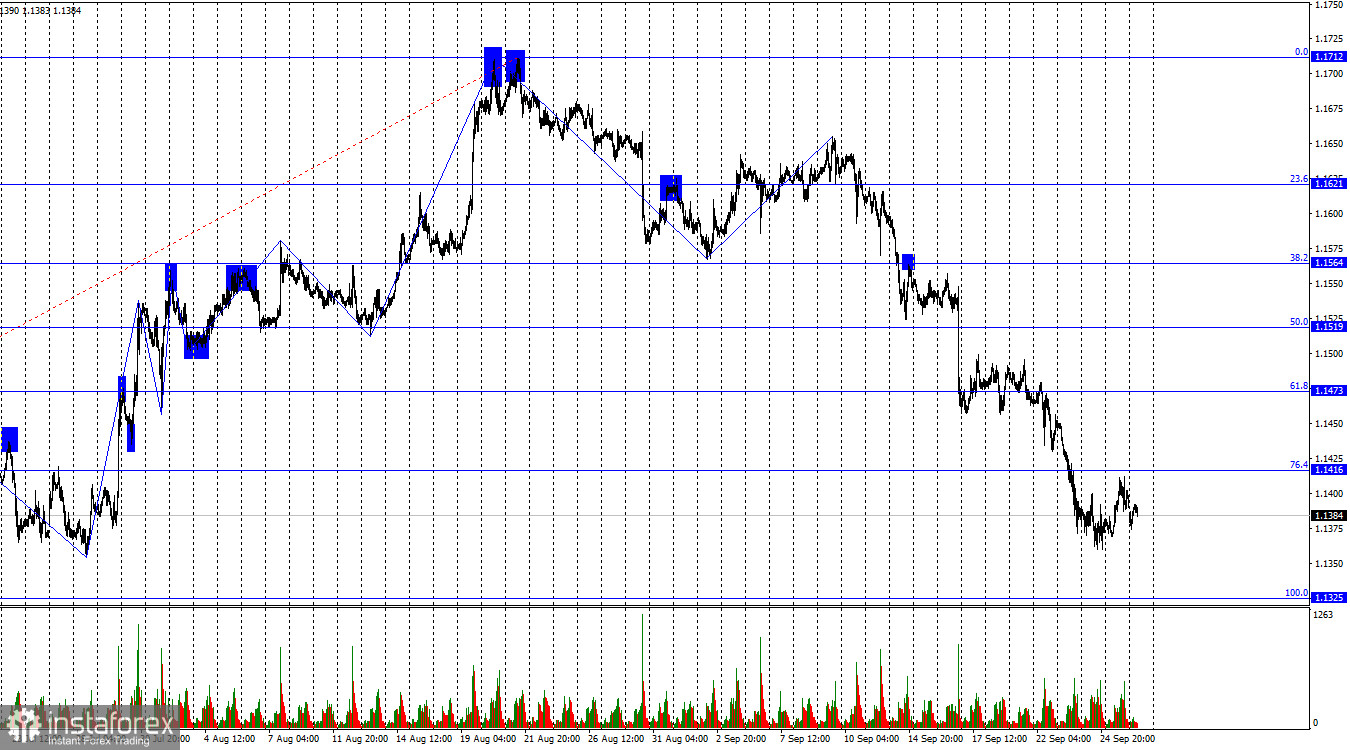
The wave situation on the hourly chart remains "bearish." The last completed upward wave failed to break the previous peak, while the last downward wave broke the previous low and has continued to develop for three weeks. Traders expect at least one more FOMC monetary policy tightening before the end of the year and another one next year. This factor continues to provide very strong support for the US currency.
The fundamental backdrop on Friday was weak and allowed the bears to continue their attacks, as the US durable goods orders report showed a less pessimistic reading than traders had expected. However, a new week has begun, and the market's attention has already shifted to the US labor market. Several secondary labor market reports will be released during the week, while Friday will bring the Nonfarm Payrolls report and the unemployment rate. Despite the relatively optimistic stance of the FOMC, not everyone considers the state of the US labor market satisfactory. Barclays stated that the labor force supply declined substantially in 2026, which became clear after the population census was conducted. The population growth rate is declining more slowly than the labor force growth rate. An aging population and slowing immigration are cited as the main problems. The bank also stated that key labor market indicators may be inaccurate and provide unreliable information because they do not account for behavioral and demographic factors. Thus, the state of the US labor market may be worse than indicated by official unemployment and payrolls reports. Does the Fed take this into account when making monetary policy decisions?
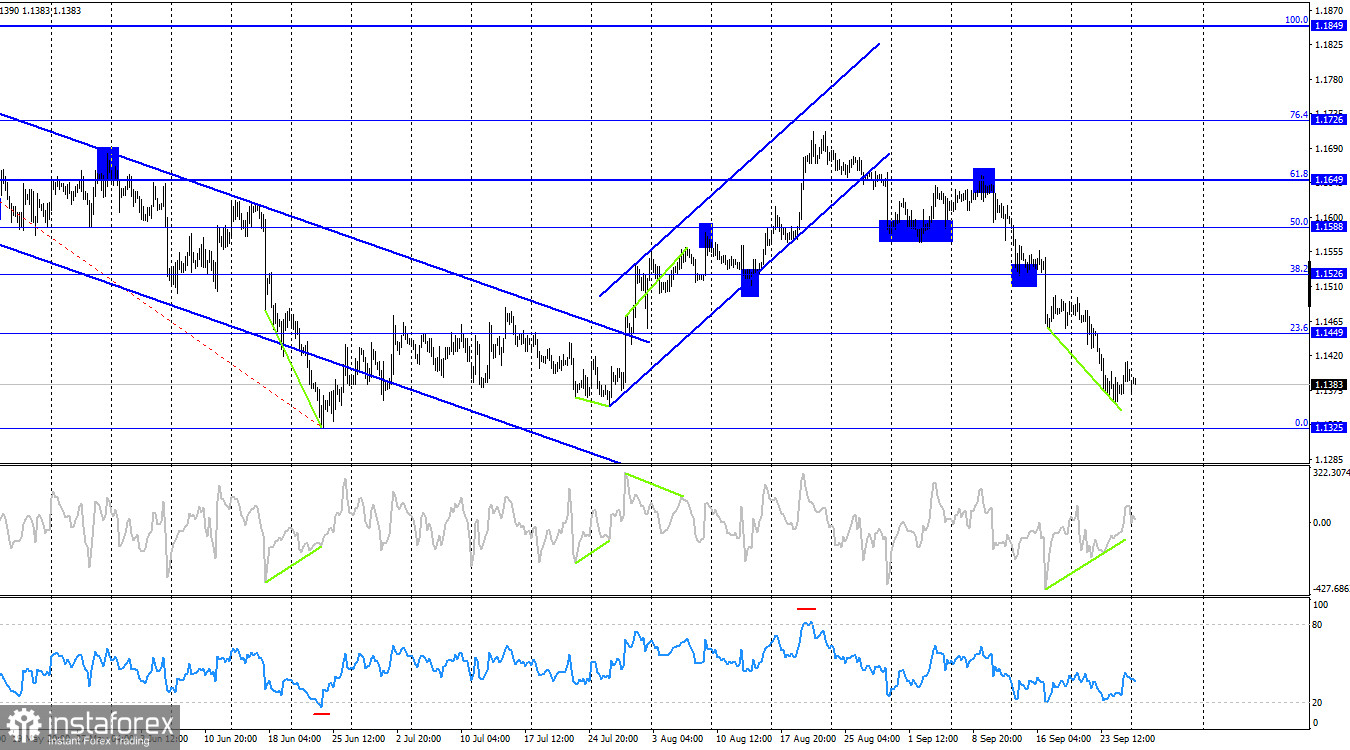
On the 4-hour chart, the pair reversed in favor of the European currency after a "bullish" divergence formed on the CCI indicator. Thus, the pair may continue to rise for some time toward the 23.6% Fibonacci level at 1.1449. A rebound from this level would favor a resumption of the decline toward the 0.0% retracement level at 1.1325. No new emerging divergences are currently observed on any indicator.
Commitments of Traders (COT) Report:
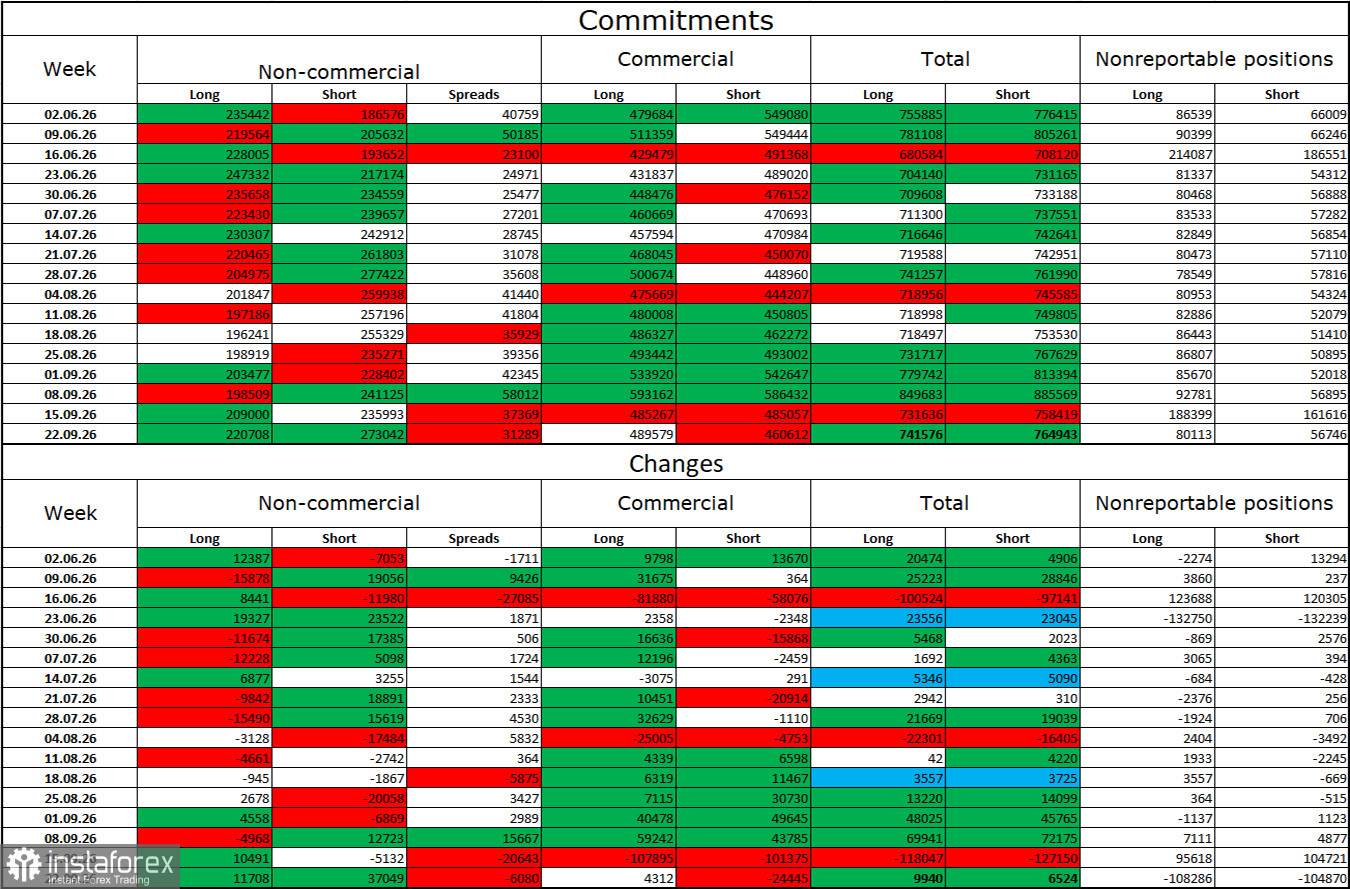
During the latest reporting week, professional traders opened 11,708 Long positions and 37,049 Short positions. During the seven weeks in February and March, the bulls' overwhelming advantage evaporated because of the war in Iran, while over the past twenty-six weeks, the situation has become more balanced amid market hopes for an end to the conflict. The total number of Long positions held by speculators currently stands at 221,000, while the number of Short positions stands at 273,000. The bears remain in the lead.
Overall, over the long term, large market participants continue to show considerable interest in the euro. Of course, events of various kinds around the world, of which there has been no shortage in recent years, affect investor sentiment and put pressure on risk-sensitive currencies. In particular, the market is currently keeping a close eye on the situation in the Middle East, where the war appears to end and then starts again. However, geopolitics no longer determines the dollar's fate on its own. At the same time, the FOMC's more hawkish monetary policy stance has strengthened the dollar in recent months.
News Calendar for the US and European Union:
On September 28, the economic calendar contains no noteworthy events. The economic backdrop will have no impact on market sentiment on Monday.
EUR/USD Forecast and Trading Tips:
Buying the pair is possible today if it closes above 1.1416 on the hourly chart, with targets at 1.1473 and 1.1519. Selling is possible following a rebound from 1.1416, with a target of 1.1325.
The Fibonacci level grids are drawn from 1.1325–1.1712 on the hourly chart and from 1.1849–1.1325 on the 4-hour chart.


